
Any explicit conservatism, or worse, implicit conservatism in the forecast, confuses prediction with utility.
Intention to Cut
My job is to forecast costs.
All my research, hypothesis testing, model selection, data selection, data validation, and model diagnostics support this goal.
Most actuarial work involves a principal: someone who will make decisions based on the actuary's estimates. Not estimating as accurately as possible denies the principal's autonomy. The principal's goals, interventions, or decisions will be frustrated because they are planning interventions for a world that evidence does not support.
The Mean Already Has a Job
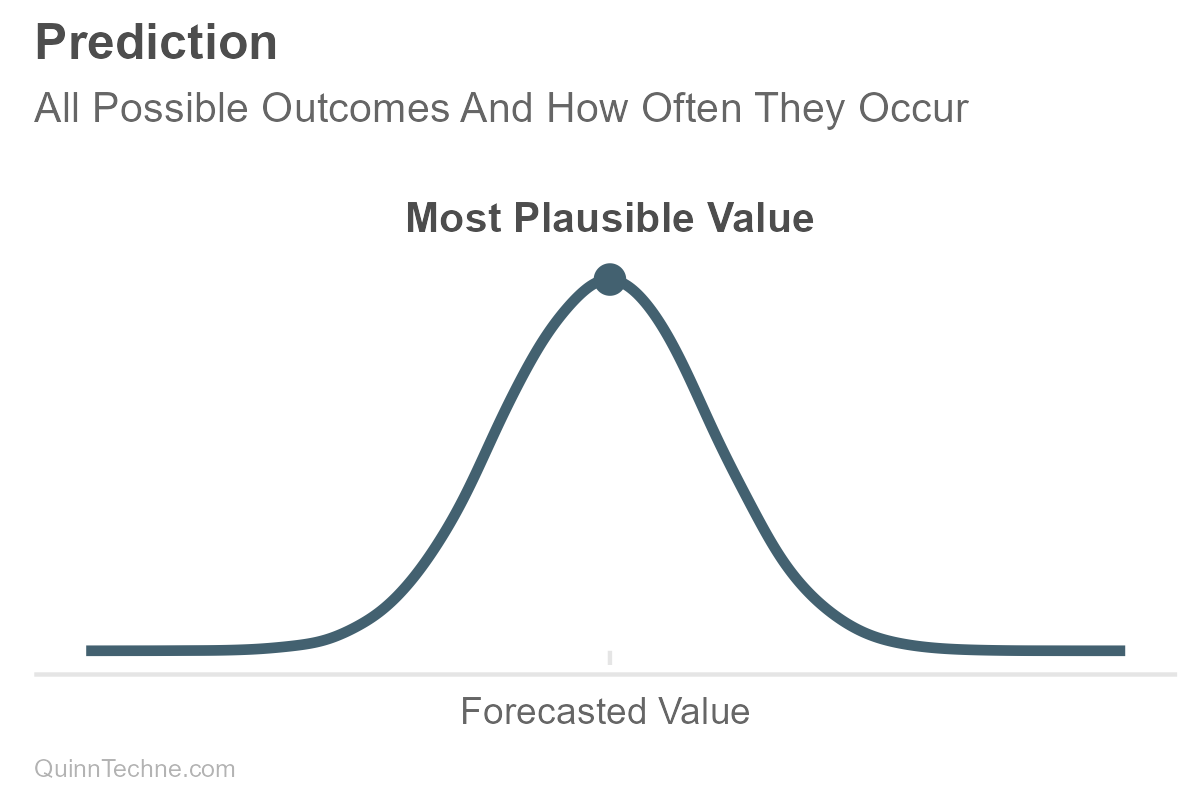
The future is unknown. Any forecast about it is a statement of uncertainty—a statement of conditional probability. Distributions describe all these possible futures and how often they occur, given the data, model, and assumptions used at the time. It is about efficiently extracting as much information as you can from the data at the time. And so if the underlying data, model, or assumption changes, so will the forecast.
Distributions are often described in terms of their center and spread. The measures of center are where the most probable forecasts usually reside. Spread encodes the forecast's precision or uncertainty. The more spread out the forecast, the less certain it is, with many values plausible across a wide range, and it's hard to pin down where reality might land.
Not Trying Is Still a Forecast
"I have encountered many people who seem paralyzed by their uncertainties. They hit a question and they are pretty sure that they won't be able to generate the right answers, and so they generate no answers." —Confidence All The Way Up
When it comes to forecasting highly uncertain phenomena, I see two odd behaviors among actuaries: One, they act timid and don't try, creating an implicit forecast of zero. Or two, the other behavior is to load the forecast up with conservatism.
This is a mistake.
I see actuaries elide uncertainty into conservatism, and this behavior arises from upstream problems. One problem is working with point-estimate means rather than the full probability distribution. This lack of thinking in distributions is a skill issue, but I'll wager it is exacerbated by the prevalence of Excel spreadsheets, where working with distributions is unnecessarily hard. Lacking a distribution, the actuary has nowhere to encode uncertainty. It's not the mean's job to encode uncertainty—means are a statistic about centers, not spread. Aware of the uncertainty but unsure of what to do with it, the actuary says, "I am unsure, therefore I will be conservative." The actuary then adds conservatism to at least one assumption, and now the prediction is biased.
Bias will harm you because the goal is accuracy.
This pattern suggests that uncertainty-into-conservatism happens because the actuary had an implicit utility function—preference for a certain outcome—and applied it too early in the decision-making process. This early application has a few problems:
- One, the forecast is now biased with conservatism, leading to worse predictions if the model was already well-calibrated.
- Second, the actuary should make the utility function explicit. Science is about checkability, which starts with writing things down clearly.
- Third, an additional problem happens when the actuary implies conservatism by cancelling ostensibly offsetting assumptions. The actuary says, "Thing A is an upward adjustment, and thing B is a downward adjustment; instead of estimating either one, I will forgo trying to estimate either and assume they cancel out." Now, the model is missing A and B, even though both might be expected steps under best practices. Neither A nor B is estimated to check whether they're similar in magnitude. Moreover, neither A nor B can propagate their uncertainty into the final forecast distribution, leading to false precision. Lastly, this decision to cancel A into B may not be documented and becomes lost.
Utility's Utility
So what should have been done? The uncertainty should be encoded in the distribution's spread. The forecast should be as accurate as possible given the data, model, and assumptions at the time. Then an explicit utility function is applied, which might lead to a decision that seems conservative compared to the most plausible values in the prediction.
Adding conservatism is not a step.
There's prediction, and there's preferences. That's it.
For example, here is a forecasted distribution that is normally distributed (bell-shaped), and suppose the actuary forecasted it as accurately as possible. Accurate in that the causal model was justified, the data reasonable, salient information encoded, and uncertainty honestly represented—a forecast you would make again given the same information. What is being forecasted can be a direct or gross value, like expected costs, attendance, sales, etc. Or you can forecast a value on a net or relative basis like profit, yield, conversion rate, and so forth.
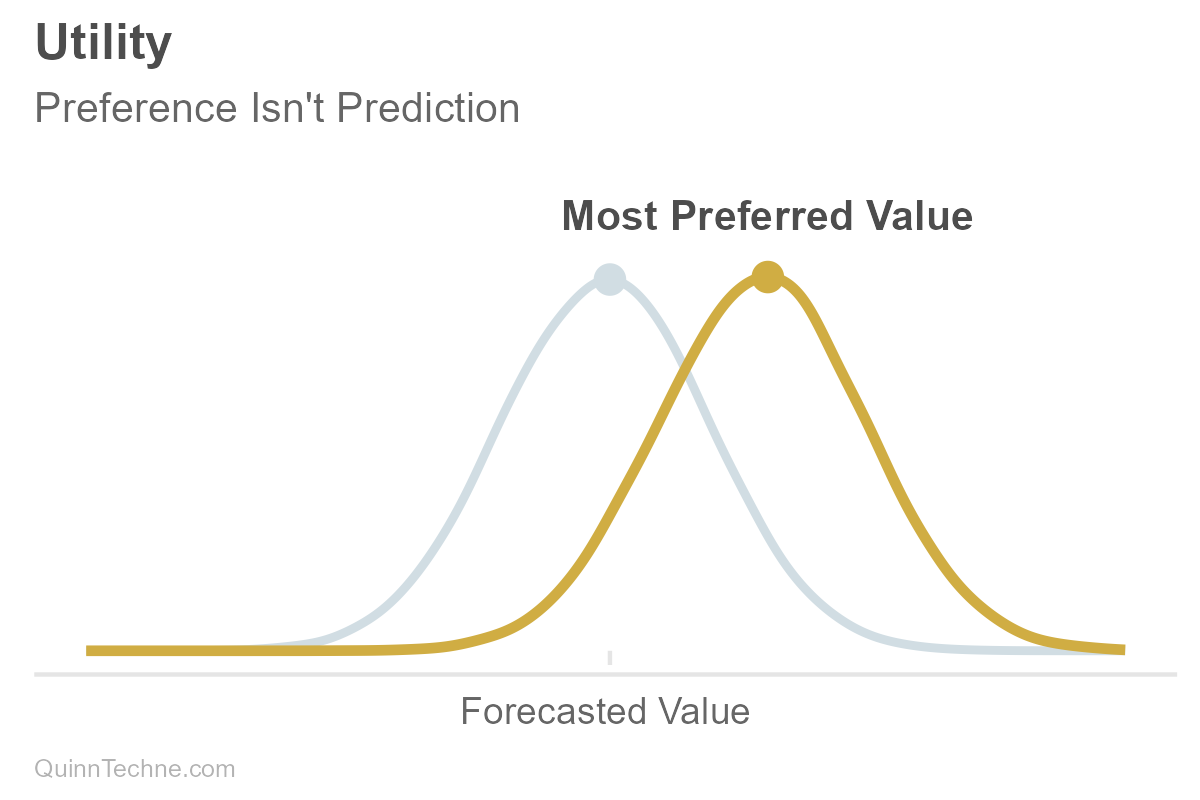
Utility can be thought of as a numerical encoding of preference. You can have a utility function that says, "For every value in your distribution, how strong is your preference at that value, that outcome?" The actuary may need to work with the principal to understand the principal's utility function. Sometimes the actuary makes the decision on the principal's behalf, which still involves knowing the principal's needs and wants. For simplicity, we'll assume our utility is also normally distributed, but the forecast or the utility function can be all sorts of distribution shapes.
Then the forecast distribution and utility function are combined to calculate expected utility—the probability-weighted average of utilities across possible values. If you have to make a decision, you choose the action that maximizes expected utility.
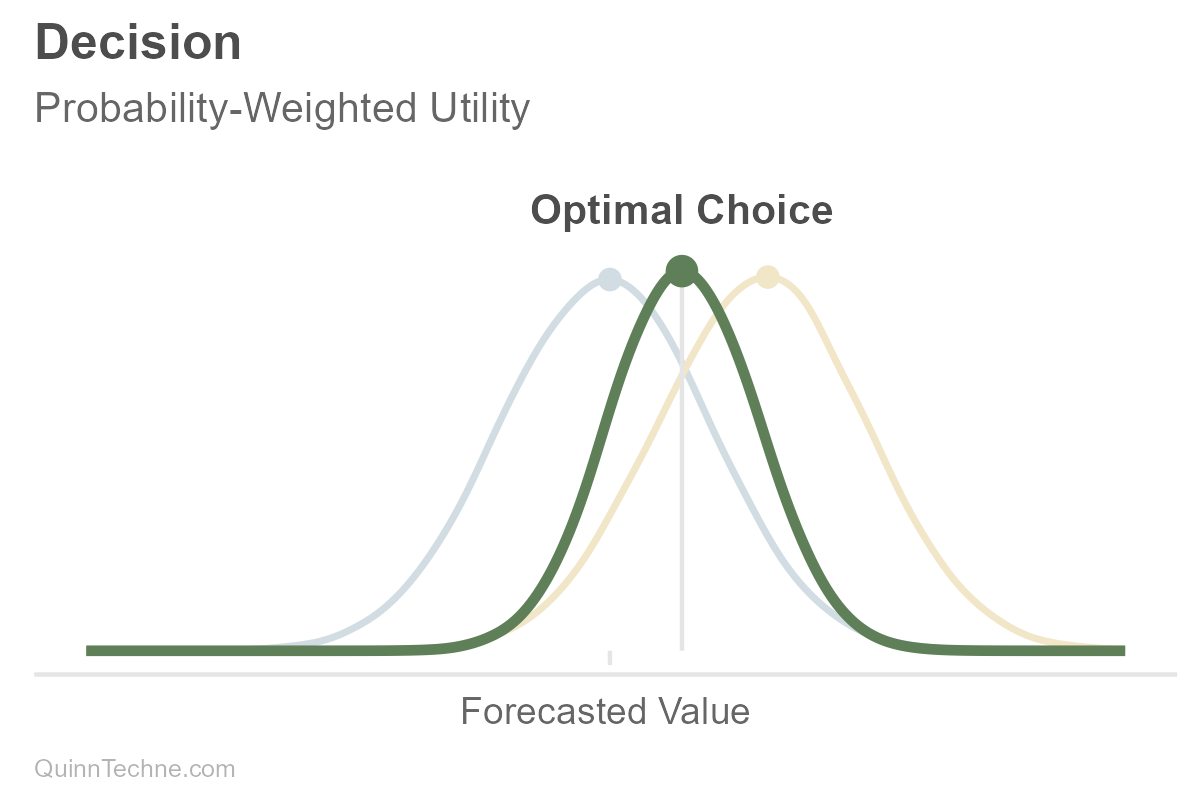
In the prior chart, note how the decision (vertical line) is a value different from the most plausible forecast value (peak of the blue predictive distribution we started with). This difference looks like conservatism, but conservatism wasn't a step. It's explicit distributions of estimates, utility functions, and point-estimate decisions.
Function's Function
Suppose you are forecasting your future savings less expenses (light blue). The utility function (yellow) is bent—shortfalls hurt more than surpluses help, a form of classic Loss Aversion: "My preference is to avoid underfunding more than I value overfunding." The more uncertain your future net costs are, the more you might save (the green choice). Note the distance between gray tick marks along the horizontal axis as the uncertainty increases. One is fixed on the left at the forecast where savings and costs equal each other, and the gray decision line moves to the right as uncertainty increases. More uncertainty, more spread, deciding to save more. It looks like conservatism because there is uncertainty. But it's predictions and preferences, forecasts and utility."
Boy, that's a lot of work. Yes. Yet the value of being explicit is that you can vet the utility function and apply it consistently.
The good news is that once you understand the underlying concepts of prediction and utility, you can sometimes simplify the decision point. For example, if your utility function is, "I only want to risk costs above funding 30% of the time," you can use the 70th percentile of the forecast itself as your decision criterion. Note how the gray line at the 70th tracks well with the peak of the green weighted-utility function that would have otherwise been our optimal decision point.
Need Not Apply
- Thinking in distributions means you know that the spread is where to encode uncertainty. It's not the mean's job.
- Keep the forecast as accurate as possible. Then make a point-estimate decision based on an explicit utility function. Don't confuse the two.
- The idea of conservatism is fine. But notice that it is not an explicit forecasting step.
Actuarial Standards Board. (2019). Actuarial Standard of Practice No. 56: Modeling. https://www.actuarialstandardsboard.org/asops/modeling-3/
Soares, N. (2016, January 17). Confidence all the way up. Minding Our Way. https://mindingourway.com/confidence-all-the-way-up/
Calculations and graphics done in R version 4.3.3, with these packages:
Wickham H, et al. (2019). Welcome to the tidyverse. Journal of Open Source Software, 4 (43), 1686. https://doi.org/10.21105/joss.01686
Wilke C, Wiernik B (2022). ggtext: Improved Text Rendering Support for 'ggplot2'. R package version 0.1.2. https://CRAN.R-project.org/package=ggtext
Generative AIs like Anthropic's Claude Opus 4.5 were used in parts of coding and reviewing the writing. Cover art was created by the author with Midjourney and GIMP.
This website reflects the author's personal exploration of ideas and methods. The views expressed are solely their own and may not represent the policies or practices of any affiliated organizations, employers, or clients. Different perspectives, goals, or constraints within teams or organizations can lead to varying appropriate methods. The information provided is for general informational purposes only and should not be construed as legal, actuarial, or professional advice.


