
Processes. Outputs. By whatever tools necessary.
Embracing the Forecaster Side of Actuarial Science
In late 2025, I entered the Bridgewater x Metaculus 2026 forecasting tournament. Metaculus is a reputation-based forecasting platform. It's open to the public, and you submit probabilistic predictions on questions and are scored against outcomes. The tournament had a $30,000 prize pool, two tracks (open and undergraduate), and questions spanning economics, geopolitics, and science.
My day job is to forecast costs. I do it all the time. But rarely do multiple actuaries forecast the same thing, and there's seldom formal scoring. Have my forecasts been overconfident? Underconfident? I had no comprehensive data on my past forecasts. The tournament changed that and I placed high enough for a silver medal and some prize money on my first go:
Resolution Criteria vs. Headline Question
A question might ask, "Will March 2026 sentiment exceed February's?" Sure, sounds straightforward. But the resolution criteria specify which measure, whether revisions count, and when the number is checked. I'd start forecasting with target [X] in mind, read others' comments on the resolution criteria, and realize I didn't understand the mechanics going into the metric. Was the metric rounded or truncated? Did the source agency revise it after initial release? Did a volunteer-based group report it? Could forecasters influence the outcome as reactive agents? More than once, the actual target turned out to be a more nuanced [X']. Now, at work, I think: "On what day will I open which database with which filters and what statistics will I look at? Because that's what I will be scored on." It's the difference between "Oh yeah, sure, we're interested in [X]" and, no, it's actually a more nuanced [X'].
Scoring Forecasts
Metaculus has a useful section on Proper Scoring Rules. A scoring rule is proper if you maximize your expected score by reporting exactly what you believe. Mathematically, your expected score peaks at your true belief:
$$E_{Y \sim Q}[S(Q, Y)] \geq E_{Y \sim Q}[S(F, Y)] \quad$$
$$\forall \, F, Q \in \mathcal{F}$$
- \(Y\): realized outcome.
- \(Q\): true distribution (what the forecaster actually believes).
- \(F\): reported distribution (what the forecaster claims to believe).
- \(\mathcal{F}\): set of all allowable forecast distributions
- \(S(F, Y)\): scoring rule that takes a forecast distribution and a realized outcome and returns a score.
- \(E_{Y \sim Q}[\cdot]\): expected value over outcomes drawn from \(Q\), the forecaster's true belief.
It is strictly proper if equality holds only when F = Q. That is, your forecast should match what you really believe in your heart-of-hearts, and you can do no better by trying any other strategy. Conservatism is not a forecasting step. If you report F equal to anything other than your true belief Q, such as Q plus conservatism, your expected score will never exceed, and under a strictly proper rule will strictly fall below, the score from reporting Q honestly. I love this because I've seen actuaries confuse prediction with preference. They explicitly or implicitly include conservatism because they'd rather be wrong in a "safe" direction, which is just smuggling in a utility function to satisfy a loss-aversion bias. A proper scoring rule punishes that. Forecast first. If a decision is being made later, that's when you can introduce a utility function and your preference for safety or conservatism.
Proper scoring is also an explicit, objective performance measure. In my work, I've compared forecasts to realized outcomes, but I've not consistently quantified forecast quality with a proper score. Now I record every final forecast, along with its resolution criteria, and score it. Much to my coworkers' annoyance, I've started scoring them, too.
Building Causal Models, Statistical Models
The first few binary questions started simple: a subjective prior, usually 50/50, because I had no background information, followed by researching the topic, looking up recent news, and updating to a posterior distribution. But even that simple process hid an implicit causal model. Evidence [X] moved the forecast, but why? Because [X] implied [A], which raised the probability of [B], which fed into the final forecast, and so forth. The model was already there, fuzzy, implicit, and inconsistently rattling around my head. I just hadn't written it down.
Making it explicit, for me, meant drawing a Directed Acyclic Graph (DAG). A DAG is a graph where nodes represent variables and directed edges represent causal relationships, with no cycles. A DAG says which variables matter and what causes what. This is one way to map the "physics" of how sentiment forms and that those experiences aggregate into the sentiment metric:
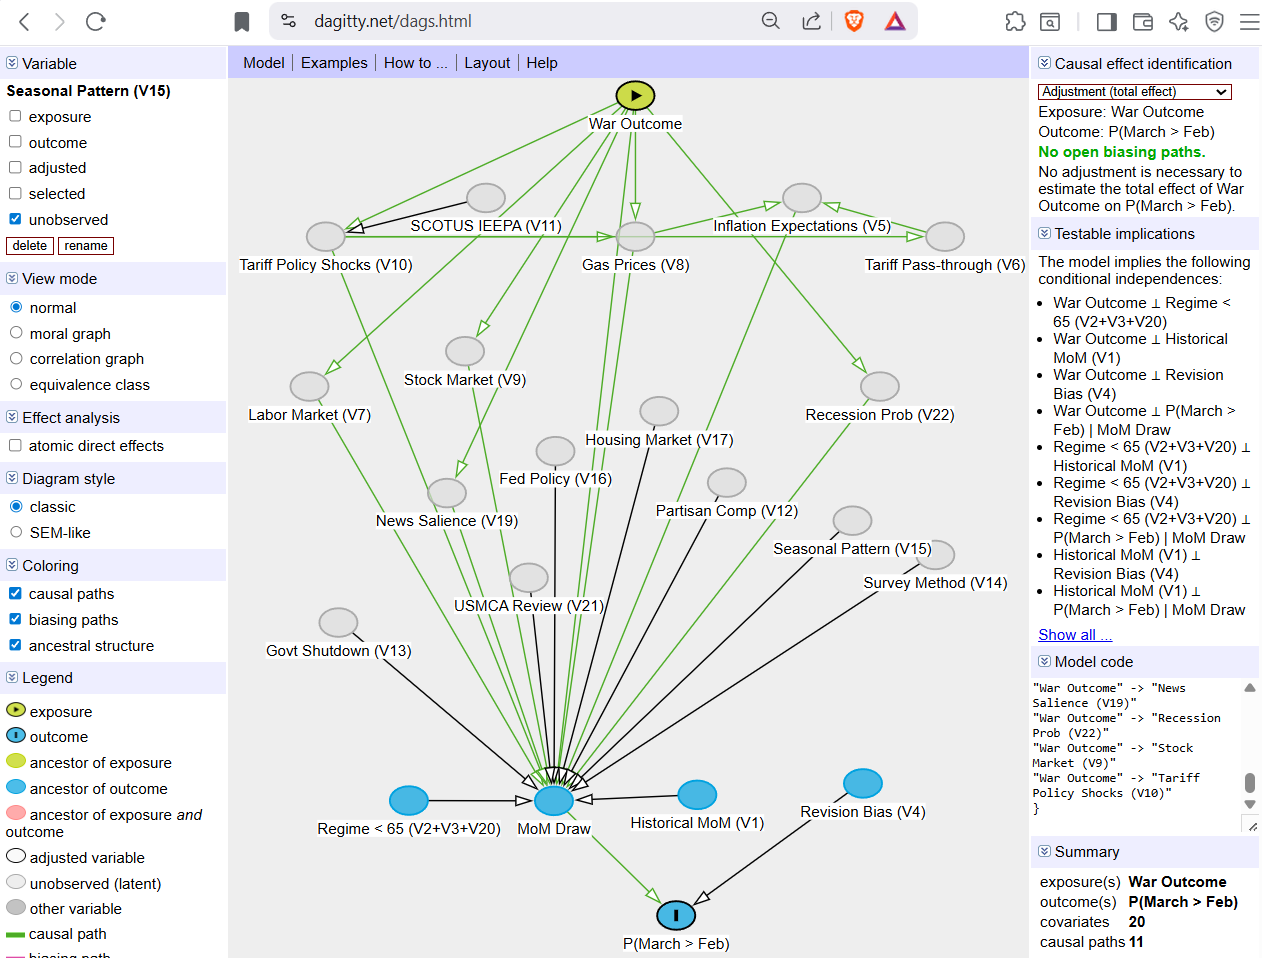
It's a useful tool. But a DAG alone is qualitative. No numbers. To forecast, you may want a mathematical formula that relates the probabilities at each node and specifies how parent and child variables feed into the final forecast. This setup is a Bayesian network. A Bayesian network is a DAG augmented with a conditional probability distribution at each node, specifying not just what causes what but how much each parent shifts the probability of its child. For example, not merely that gas prices affect consumer sentiment, but a spike in gas prices lowers the probability of positive sentiment from 65% to 30%.
The DAG encodes the causal story and evolves into a Bayesian network, which operationalizes it into a forecast. Here's what that looks like in practice. One tournament question asked whether March 2026 consumer sentiment would exceed February's measure:
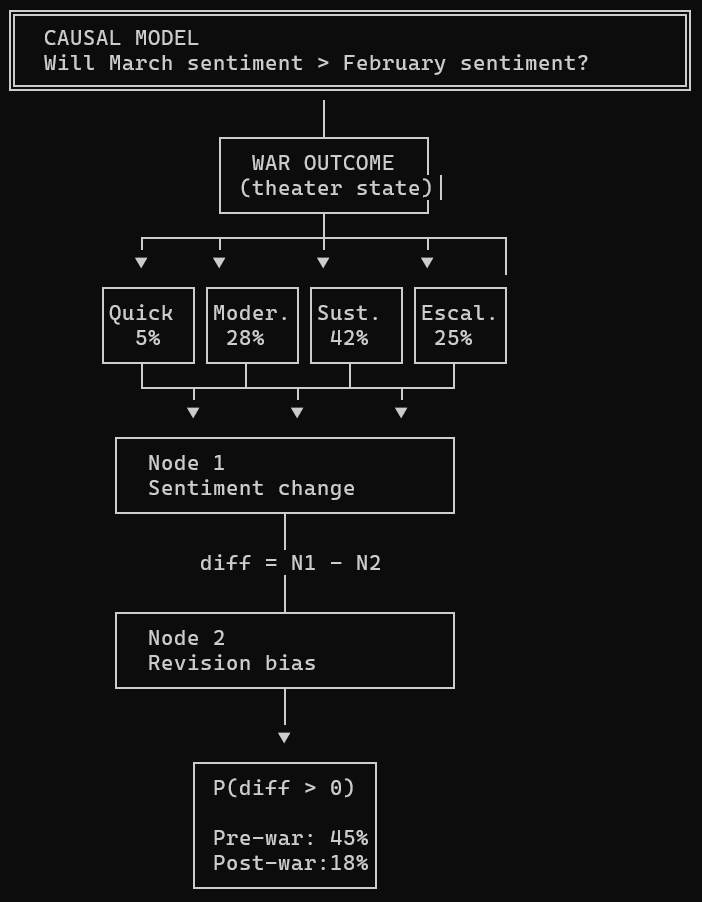
The causal model outlines the steps required to meet the resolution criteria. The Bayesian network maps the causal model onto a forecast function. For example, if you have scenarios [A], [B], and [C] that feed the forecast, you could have:
$$P(X_1, \ldots, X_n) = \prod_{i=1}^{n} P(X_i \mid \text{Parents}(X_i))$$
Or for example the four (i) mutually exclusive war scenarios:
$$P(\text{Sentiment Up}) = \sum_i P(\text{Sentiment Up} \mid \text{War} =
i) \cdot P(\text{War} = i)$$
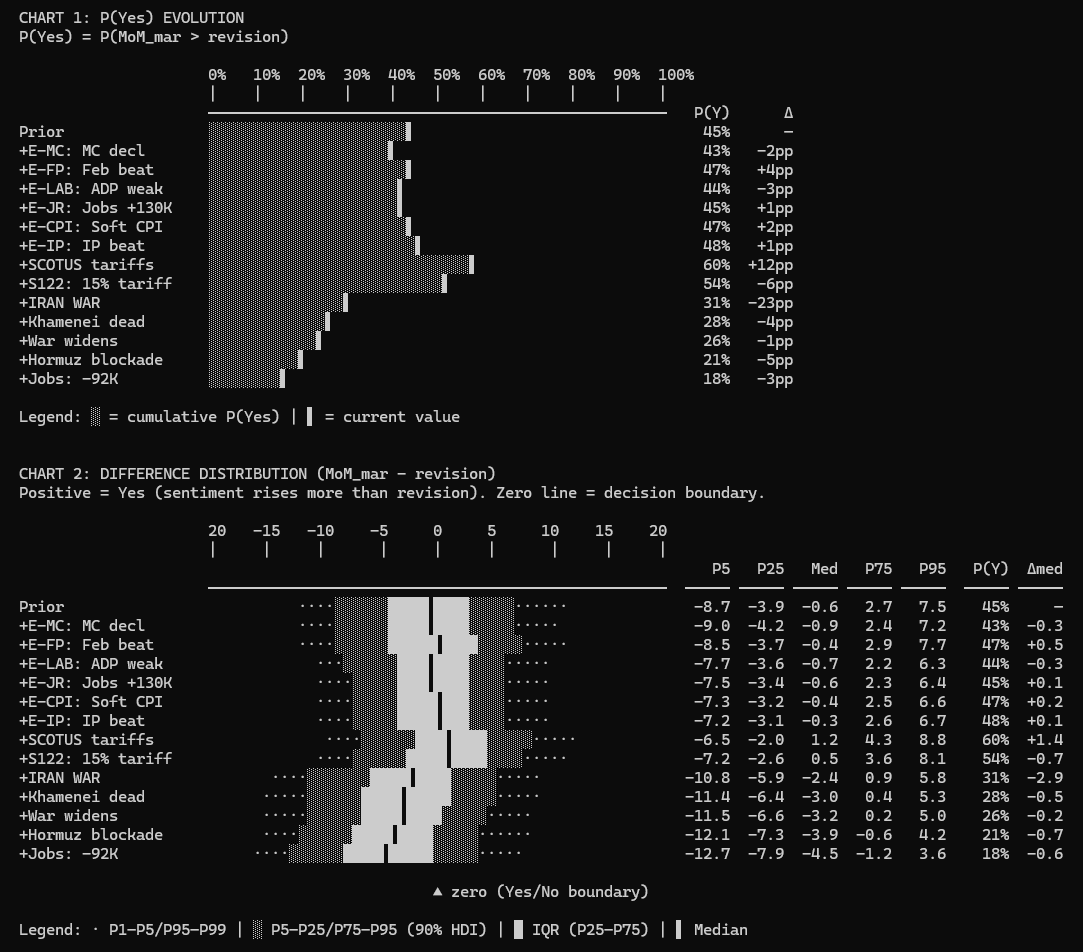
The Bayesian network factorizes (decomposes) the joint probability according to the graph structure. Each node is conditioned only on its parents. The graph tells you which dependencies matter and which you can ignore. When new evidence arrives, say, bombs dropped in the Middle East, it propagates through the network, and the posterior forecast updates. For example, this chart shows how each piece of evidence moved the forecast over the life of the question:
I've seen actuaries build the causal model but fail to map it to a statistical model. Or they start with the math, but it's unanchored from the physics. The DAG and Bayesian network sync both halves.
Becoming Tool Agnostic
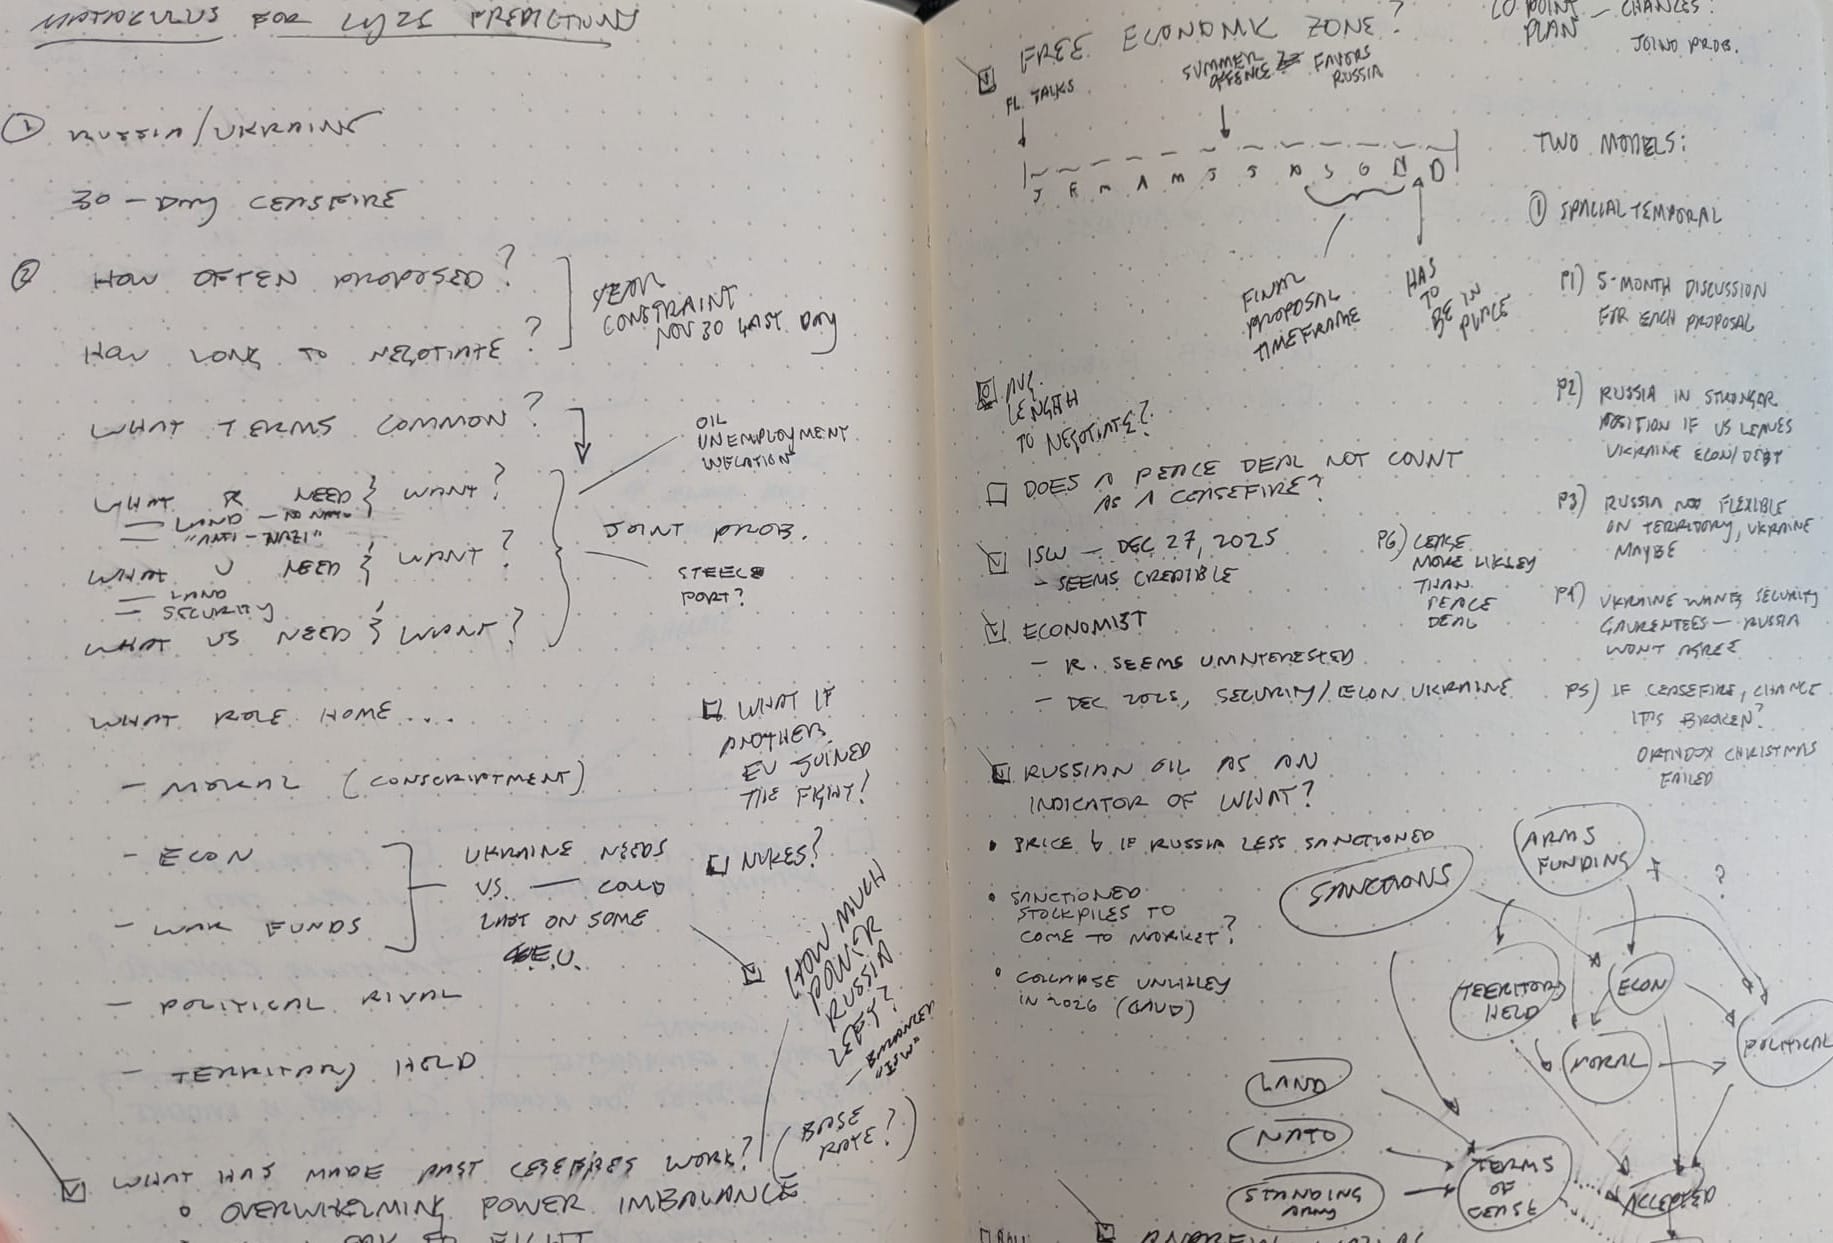
Prior to this tournament, I had studied actuarial science, Bayesian inference, and causal inference statistics, and was familiar with Philip E. Tetlock and Dan Gardner's book Superforecasting. I knew many methods but didn't have a process for forecasting questions I knew little about. And so my journey and first tournament forecast started on paper:
I then considered an Obsidian markdown file to track research. That quickly gave way to a web browser with Claude and ChatGPT for research and maintaining a persistent forecast document. Then, a software developer friend suggested Claude Code, Anthropic's command-line tool that lets Claude read and write files on your hard drive. Forecasts live in folders with persistent model documentation, research logs, and standing instructions for updating when new evidence arrives. Not only that, but it was easy to create iterative loops of improving and remembering your preferences so each forecast could build on what you learned or refined from the prior one. I was hooked! I went from $20 to $100 to $200 max subscription in no time—no regrets.
By the end of the tournament, the choice of tool, the choice of Excel, R, or DAGitty, had disappeared. It was 99% Claude Code. I'd batch entire sets of questions and never look at the code, only at selected output, most rendered in ASCII inside Claude Code. It didn't start that way. Early on, I would review output in detail, manually search for evidence, and compose ad-hoc prompts as we went. But the process became increasingly automated through the iterative improvement process: "Claude, you know that thing we just did? We're going to do that a lot, so research the best way to do it and write down a process we can consistently call. Thanks, byeeee." This evolved into a stable forecasting suite that followed this process:
Model Specification (one-time step)
- Scope — Define the question, resolution criteria, resolution source, date. "What exactly am I forecasting and how will it be scored?"
- Brainstorm — List all plausible causal variables. Draw the evolution path (which nodes to add in what order). Divergent thinking.
- Build — Three phases:
(A) Baseline causal model with just the most important node(s)
(B) Expand one node at a time, justify each addition, stop when complexity overtakes improvement. Final causal model.
(C) Write the model (structural equations, distribution families, parameters) - Backtest — Calibrate sigma against historical holdout error (skip if no data).
- Pre-register — Lock in parameter shift ranges before looking at evidence. "If I see [X], I'll shift this node by [Y]." This prevents motivated reasoning. (If Claude is even capable of this–it was trained on human data...)
Memory File (dynamic, updated repeatedly)
- Update — Search for evidence, map each piece to a node in the Bayesian network, apply pre-registered shifts, re-simulate. Repeat as new evidence arrives.
- Sensitivity — Audit the updates. Ensure true belief with no conservatism bias. Check that the files are up to date and consistent. Calculate which nodes are most sensitive.
- Finalize — Archive, create a summary, submit forecast, record resolution, and post-mortem afterward.
I also built separate Claude agents to fact-check news sources and run audits of the main forecasting model. The final process outputs were statistics and charts I wanted to know or review to be comfortable with the model. What's our DAG and why? How well does our model explain past observations? What evidence would make us change our minds? What is our record of considered evidence, and how did it change our forecast each time? And so forth.
Getting to better forecasts might mean freeing ourselves from tools that preclude us from using good processes (have you tried modeling with distributions in Excel recently? Have you drawn a DAG with anything but pen and paper?). Actuaries using generative AI with a universal UI might be the future industry tool choice.
Processes and Outputs
As I think about the future of actuarial work, actuaries should embrace the forecaster ethos. We already forecast. We just do it without the discipline that would make forecasts more accurate. No explicit causal models. No formal scores. No tracked evidence. Forecasting tournaments impose all three. There's a scoreboard—you'll know where you stand.
Anthropic. (2025). Claude (Large language model). https://www.anthropic.com
Metaculus. (n.d.). Scores FAQ. Retrieved March 30, 2026, from https://www.metaculus.com/help/scores-faq/
Proper scoring rule. (n.d.). In Wikipedia. Retrieved March 30, 2026, from https://en.wikipedia.org/wiki/Scoring_rule
Tetlock, P. E., & Gardner, D. (2015). Superforecasting: The Art and Science of Prediction. Crown Publishers.
Textor, J. (n.d.). DAGitty: A graphical tool for analyzing causal diagrams (Version 3.x) [Web application]. https://dagitty.net/dags.html
Generative AIs like Anthropic's Claude Opus 4.6 were used in parts of coding and reviewing the writing. Cover art was created by the author with generative AI.
This website reflects the author's personal exploration of ideas and methods. The views expressed are solely their own and may not represent the policies or practices of any affiliated organizations, employers, or clients. Different perspectives, goals, or constraints within teams or organizations can lead to varying appropriate methods. The information provided is for general informational purposes only and should not be construed as legal, actuarial, or professional advice.


