Any and every forecast is predicated upon a fount of knowledge; forecasts are therefore conditional probability statements, the conditioning being on the existing state of knowledge. If we change our knowledge base, then, typically, our forecast will change.
—Applied Bayesian Forecasting and Time Series Analysis
Whence this range?
It's a good idea to describe your forecasts with a probability distribution because it describes all possible forecasts and how likely they are given the background information, data, and model used. Note the word "given." All probability is conditional probability. If your background information, data, or model changes, so too will your forecast.
If you gain new information but fail to update your distribution, then you will have problems. In practice, a failed update can conflate the roles of center and spread.
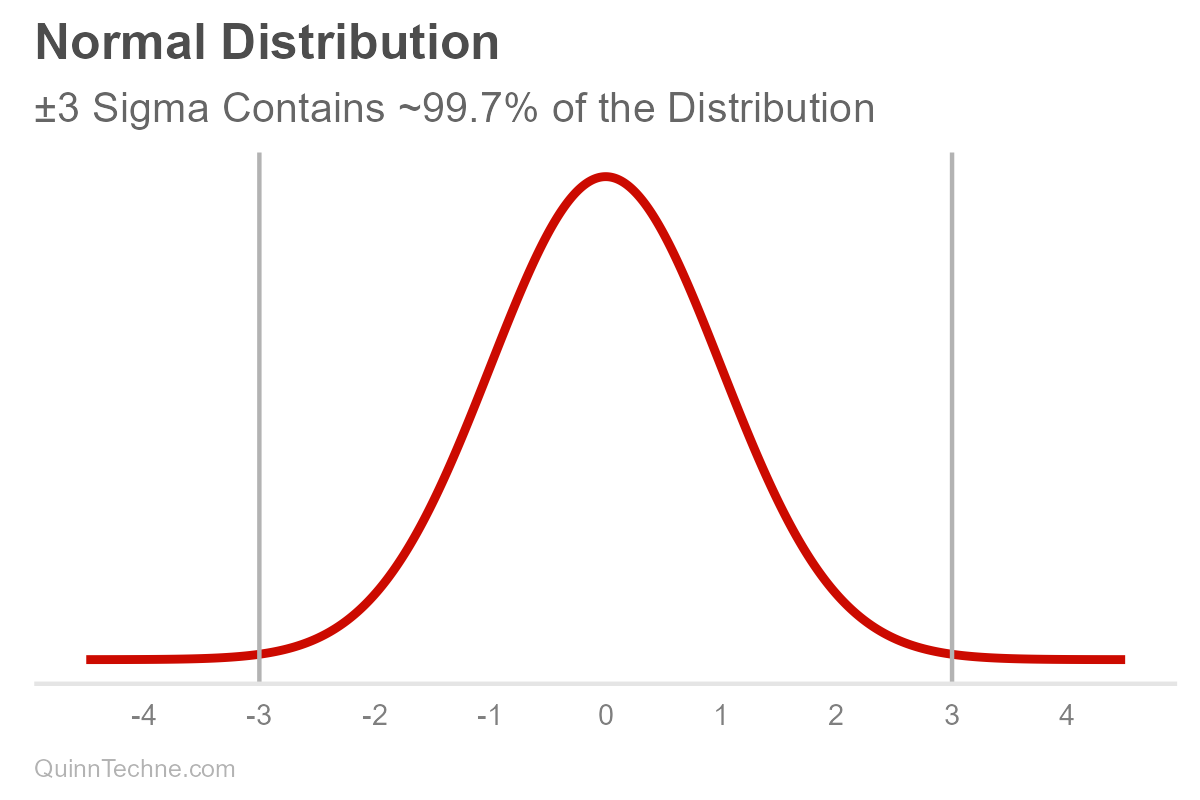
Suppose you have a forecast. We'll assume it's normally distributed, bell-shaped. It has a center, mean (μ, pronounced mu), and it has spread, measured in standard deviation (σ, pronounced sigma). These values, mu and sigma, are parameters. For some, the spread is the range where the most plausible values reside. Note that ±3 sigma essentially covers the distribution's range where most of the area under the curve is:
These parameters are conditional (and have their own distributions, too! But we won't get into that here). It's easy to forget that parameters are conditional because we say "center" or write "mu," but nothing signifies it's conditional—out of sight, out of mind. But it's always there. Hiding. Let's make the conditional part explicit for now.
$$\mu, \sigma \big| \text{background information}, \text{data}, \text{model}$$
The parameters mu and sigma are conditional on our background information, data, and model. If one of these conditionals changes, then so do our parameters, mu or sigma, and therefore our distribution, too. For example, here is only mu being updated (and sigma held fixed).
Here is what would happen if only sigma were updated. Remember, our uncertainty is encoded in the spread.
However, the distribution is composed of all its parameters. If there is new information, the entire distribution updates.
Even if you use heuristics in practice, understanding the formal framework of thinking in distributions reveals where shortcuts can be problematic. For example, when one has new information but assumes the outdated distribution still holds. They think of the new mean, see that it fits within the un-updated range, and call it good. For example, the blue vertical line here:
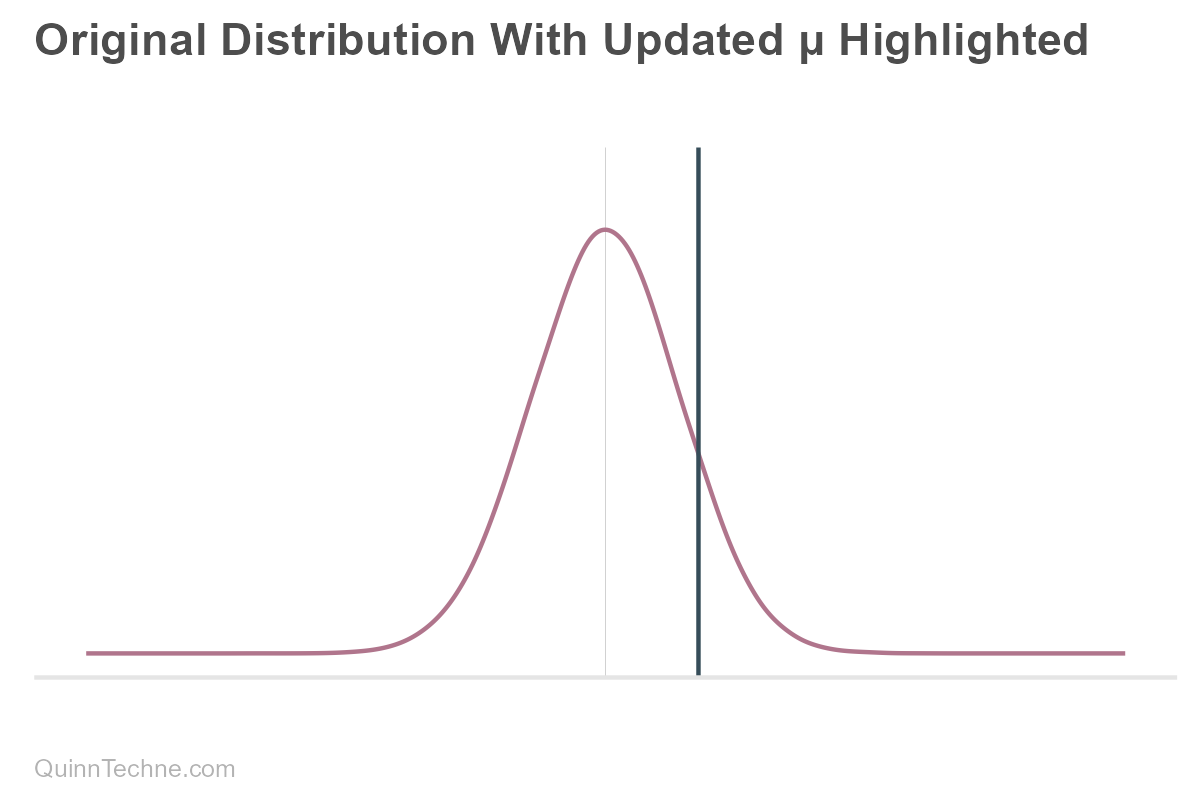
What could go wrong?
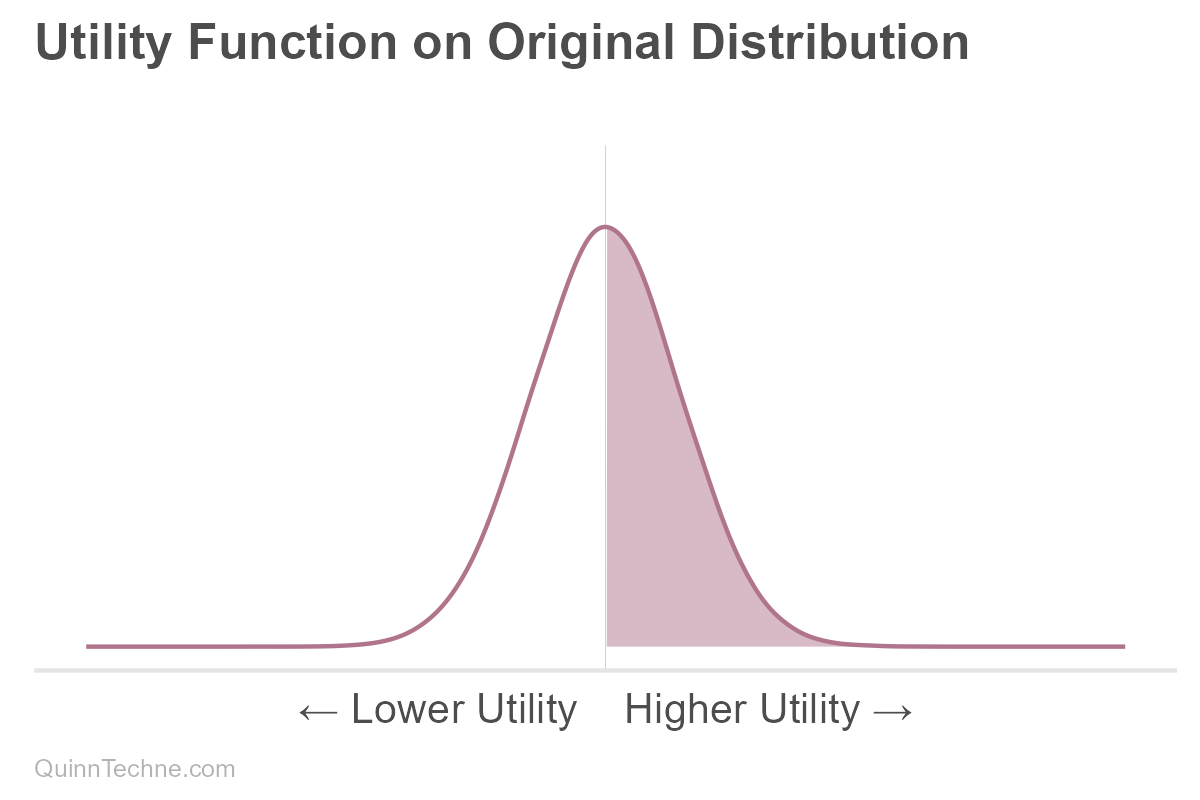
Well, any downstream probability or utility function is now tainted. For example, this problem can manifest in a utility function. Suppose one gets positive utility the higher a value is than the distribution mean, highlighted here:
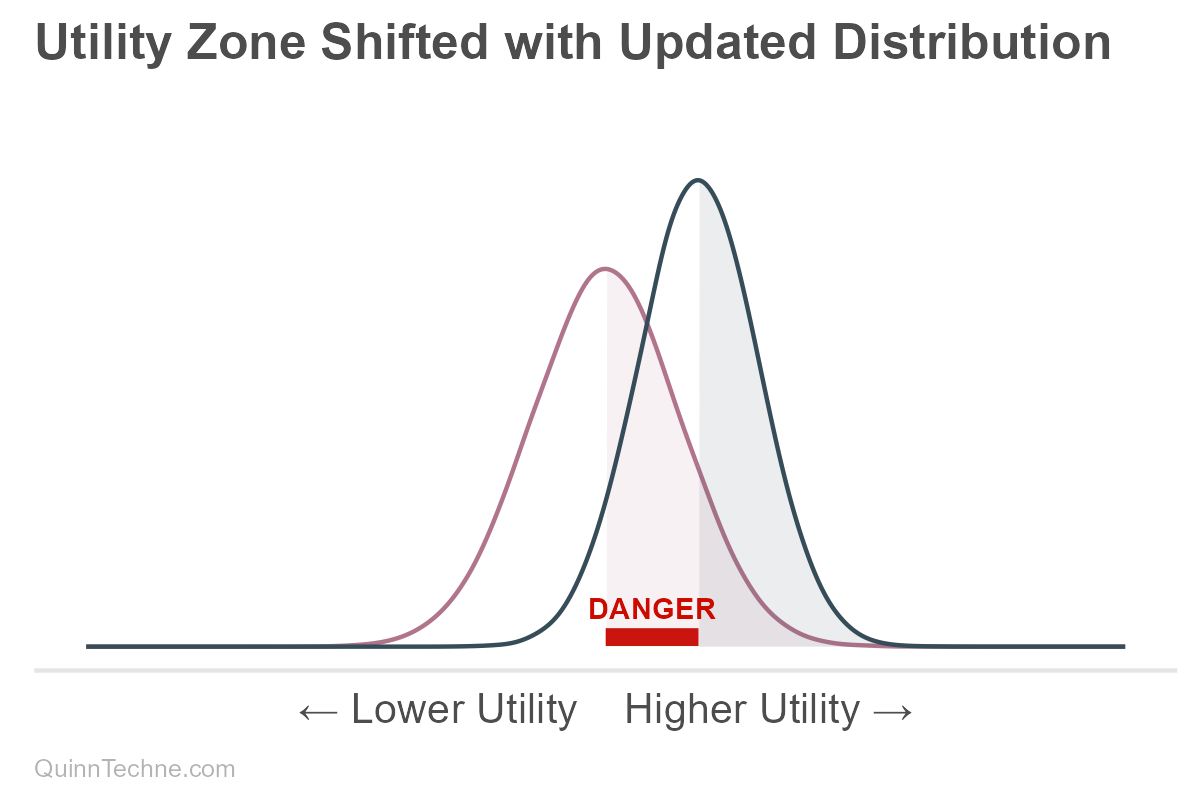
If utility is measured on the old distribution, there is a dangerous spot where utility looks positive, but the updated distribution shows that same area as lower utility. For an x-axis value in that red zone, one who did not update might think they were getting higher positive utility when, in fact, they are not.
The spread is to encode uncertainty and is not slack to avoid having to update the distribution's center.
Abide by Thine Updated Distribution
- If you have relevant background information not yet encoded in your distribution, encode it.
- If you have relevant data not yet encoded in your distribution, encode it.
- If you have a causal belief not yet reflected by your model distribution, encode it.
Pole, A., West, M., & Harrison, J. (1994). Applied Bayesian Forecasting and Time Series Analysis. Chapman and Hall/CRC.
Calculations and graphics done in R version 4.3.3, with these packages:
Qiu Y (2024). showtext: Using Fonts More Easily in R Graphs. R package version 0.9-7. https://CRAN.R-project.org/package=showtext
Wickham H, et al. (2019). Welcome to the tidyverse. Journal of Open Source Software, 4 (43), 1686. https://doi.org/10.21105/joss.01686
Wilke C, Wiernik B (2022). ggtext: Improved Text Rendering Support for 'ggplot2'. R package version 0.1.2. https://CRAN.R-project.org/package=ggtext
Generative AIs like ChatGPT and Claude were used in parts of coding and writing. Cover art was done by the author with Midjourney.
This website reflects the author's personal exploration of ideas and methods. The views expressed are solely their own and may not represent the policies or practices of any affiliated organizations, employers, or clients. Different perspectives, goals, or constraints within teams or organizations can lead to varying appropriate methods. The information provided is for general informational purposes only and should not be construed as legal, actuarial, or professional advice.


